
The question I chose to answer for my inquiry project this semester is “How might climate change affect life in my community in the next 50 years?” The first step I will have for my research is finding out how climate change and global warming has evolved in the last 50 years. My main goal for this round will be to get a better idea of the rate and severity and find patterns to try and predict what will happen in the future.
- The temperature of the Earth has risen by an average of 0.06° Celsius (0.11° Fahrenheit) per decade since 1850. The rate of warming since 1982 is over triple as fast: 0.20° Celsius (0.36° Fahrenheit) per decade.
- 2024 was the warmest year since global records began in 1850 by a wide margin. It was 1.18°C (2.32°F) above the 20th century average of 13.9°C (57°F). It was 1.35°C (2.62°F) above the pre-industrial average (1850-1900) of 13.7°C (56.7°F).
- From 1975-2024, the temperature has gone up 1.27°C (1).

- The earth has undergone 8 cycles of ice ages and warmer periods in the last 800 000 years, with the end of the last ice age about 11 700 years ago.
- Ice cores that were taken from Greenland, Antarctica, and tropical mountain glaciers show that Earth’s climate responds to changes in greenhouse gas levels. Ancient evidence can be found in tree rings, ocean sediments, coral reefs, and layers of sedimentary rocks. This evidence reveals that current warming is happening around 10x faster than the typical average rate of warming after an ice age. Carbon dioxide from human activities is increasing about 250x faster than it did from natural sources after the last Ice Age.
- Earth’s average surface temperature has risen about 1°C since the late 19th century, a change hugely driven by increased CO2 emissions into the atmosphere and other human activities. Most of the warming occurred in the past 4 decades, with the 7 most recent years being the warmest. The years 2016 and 2020 are currently tied for the warmest year on record.
- On top of that, the ocean has absorbed much of this increased heat, with the top 100 meters (about 328 feet) of ocean showing warming of 0.33°C since 1969 (2).
- We are pushing our planet’s thermostat beyond the safe levels of 350 ppm (parts per million) CO2 concentration in the atmosphere.
- When the atmospheric CO2 trend begins to falter and fall, we should expect global average temperature to follow.
- One year ago today, on November 17th 2024, the ppm was 423.63. In the past year it increased 3.21 ppm, now being 426.84.
- Atmospheric CO2 is higher now than at any time in the past 200 000 years of human history. Studies of past CO2 levels have accumulated evidence of CO2 levels being lower than 400 ppm for the past 23 million years. That makes the current CO2 records the highest in human history plus a period that’s a hundred times the 200 000 years that humans have been around. But the current elevation of CO2 levels is just one side of the problem. The other is the speed of the changes in atmospheric composition, which is over 100 times the speed of change pre Industrial Revolution.

- The highest daily atmospheric CO2 concentration record in 2025 so far has been March 7th, with 430.6 ppm. The record in 2015 was 404.84 ppm, on April 13th, meaning in the past 10 years the record has gone up 25.76 ppm.
- The Earth’s global average surface temperature in December 2024 was 1.55°C above the average for the pre-industrial comparison period of 1880-1920 (3).
- Based on the annual mean temperature ranking, the top 10 warmest years were all in the past decade: 2015-2024 (4).
- The atmospheric concentrations of carbon dioxide, methane, and nitrous oxide have increased significantly since the Industrial Revolution began. For carbon dioxide, the average concentration measured at the Mauna Loa Observatory in Hawaii has risen from 316 ppm in 1959 (which was the first full year of data available) to over 411 ppm in 2019. The same rates of increase have been recorded at numerous other stations worldwide. Since preindustrial times, the atmospheric concentration of CO2 has increased by over 40%, methane has increased by more than 150%, and nitrous oxide has increased by approximately 20%. More than half of the increase in CO2 has occurred since 1970.
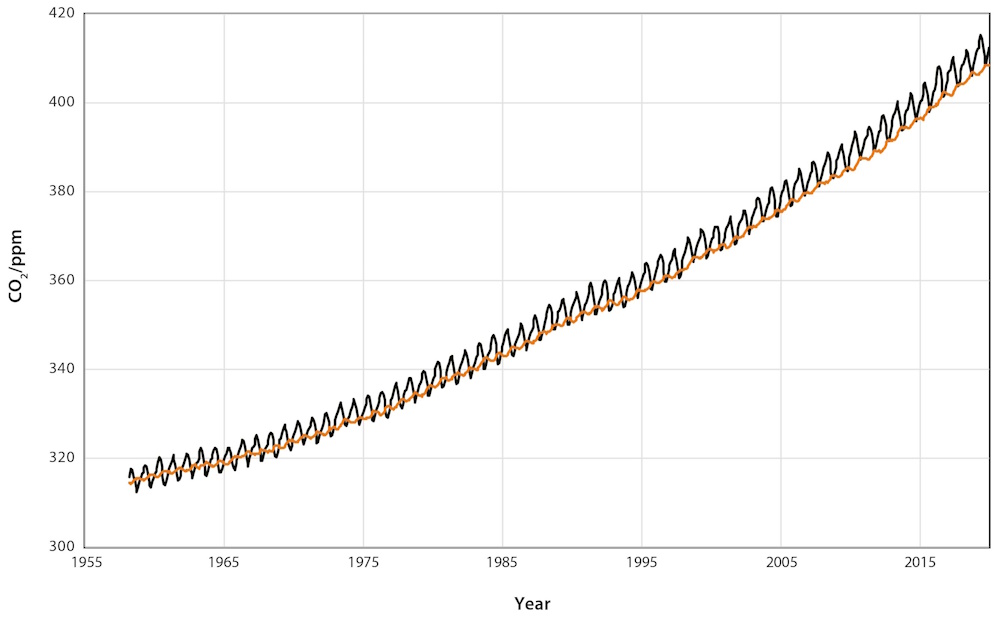
- Analysis of air trapped inside ice that has been accumulating over time in Antarctica shows that the CO2 concentration started to increase significantly in the 19th century after staying in the range of 260 to 280 ppm for the previous 10 000 years. Ice core records extending back 800 000 years show that during that time, CO2 concentrations stayed within the range of 170 to 300 ppm throughout the many ice age cycles and no concentration above 300 ppm is seen in records until the past 200 years.
- Multiple independent teams have concluded separately that global average surface air temperature has risen by about 1 °C since 1900.
- Global temperatures are rising towards peak temperatures last seen 5000 to 10 000 years ago in the warmest part of our current interglacial period.
- More impacts associated with the warming trend have become clear in recent years. Arctic summer sea ice cover has shrunk dramatically. Global average sea level has risen by approximately 16 cm since 1901, due to the expansion of warmer ocean water and to the addition of melt water from glaciers and ice sheets on land. Changes in warming and precipitation are altering the geographical ranges of many plants and animals, and the timing of their life cycles (6).

- Since 1896, average winter temperatures across the 48 continental US states have increased by about 3°F. Spring temperatures have increased by about 2°F, while summer and fall temperatures have increased by about 1.6°F.
- Wainter is particularly vulnerable to rising temperatures. Overall, minimum temperatures have increased at a faster rate than average maximum temperatures. A lot of the observed warming in the US has taken place when and where it is usually the coldest (during winter, at night, and in the northern parts of the country.) Although the country has experienced many winters with unusually low temperatures, unusually cold winter temperatures have become less common, particularly very cold nights. Changing winter temperatures directly influence the amount of snow that falls and accumulates, amount of seasonal snowpack, timing of snowmelt runoff, loss of soil moisture through evapotranspiration, and amount of time that lakes are frozen (6).
- Every increase in global warming matters. Scientists and governments agree that limiting global temperature rise to no more than 1.5°C would aid in avoiding the worst climate impacts and maintaining a liveable climate. But the policies currently in place point to an increase in global temperature of as much as 3.1°C by the end of the 21st century (7).
In round 2, I am planning to dive deeper into the biggest factors and causes of climate change, and how they affected the speed of its growth. I will try to find ways to reduce these key factors in the future and develop a better understanding of why these factors have the impact they do.
Thank you for reading!
References:
- https://www.climate.gov/news-features/understanding-climate/climate-change-global-temperature
- https://science.nasa.gov/climate-change/evidence/
- https://www.co2.earth/daily-co2
- https://www.columbia.edu/~mhs119/Temperature/
- https://royalsociety.org/news-resources/projects/climate-change-evidence-causes/basics-of-climate-change/
- https://www.epa.gov/climate-indicators/climate-change-indicators-us-and-global-temperature
- https://www.un.org/en/climatechange/science/key-findings


Hey, Kylie! This is a very insightful post, your passion and effort is very clear through this! I really liked how in depth you’ve gone with your research, not only mentioning the temperatures over the years, but it’s causes and other affects, just like you wrote about CO2 and air trapping in ice, and the rising sea levels of the world. I learned something new from you, like our Earth’s safety ppm level, so thanks! I think next time it could incredibly interesting to see your take and research on the affects on aspects of society, so things like social and economic development in the future, here might be some useful links to use if you’d like to:
•https://19january2017snapshot.epa.gov/climate-impacts/climate-impacts-society_.html
•https://www.noaa.gov/education/resource-collections/climate/climate-change-impacts